Institutional Case Study: Max Planck Society
The previous sections provide top-down market perspectives. Here, I shift to an institutional view to show how platform adoption, sequencing volume, and library strategy choices vary across research institutes.
As a case study, I use the Max Planck Society (84 institutes). A subset of institutes appears in my metadata database, enabling structured comparisons of platform usage, read-length profiles, and library strategy composition.
Institutes present in this dataset
- Max Planck Institute for Evolutionary Anthropology
- Max Planck Institute for Chemical Ecology
- Max Planck Institute of Immunobiology and Epigenetics
- Max Planck Institute for Plant Breeding Research
- Max Planck Institute for Marine Microbiology
- Max Planck Institute for Evolutionary Biology
- Max Planck Institute for Molecular Genetics
- Max Planck Institute for Biology Tuebingen
- Max Planck Institute for Biology of Ageing
- Max Planck Institute for Biogeochemistry
- Max Planck Institute for Ornithology
- Max Planck Institute for Molecular Biomedicine
- Max Planck Institute for Biophysical Chemistry
- Max Planck Unit for the Science of Pathogens
- Max Planck Institute for Terrestrial Microbiology
- Max Planck Institute for Chemistry
- Max Planck Institute for Heart and Lung Research
- Max Planck Institute for the Science of Human History
- Max Planck Institute for Infection Biology
- Max Planck Institute of Molecular Plant Physiology
- Max Planck Institute of Molecular Cell Biology and Genetics
Guiding questions: Which institutes account for the majority of sequencing output? How do their platform mixes differ (short-read vs long-read)? And how do library strategies vary across institutes, reflecting distinct scientific priorities and pipeline constraints?
.png)
An example is shown in the plot above: each bubble represents a platform-institute combination. The x-axis reflects average read length, the y-axis reflects total bases, and bubble size indicates experiment count. A small number of institutes (e.g. MPI Tübingen) dominate total output, consistent with institutional concentration of sequencing infrastructure and throughput-intensive programmes.
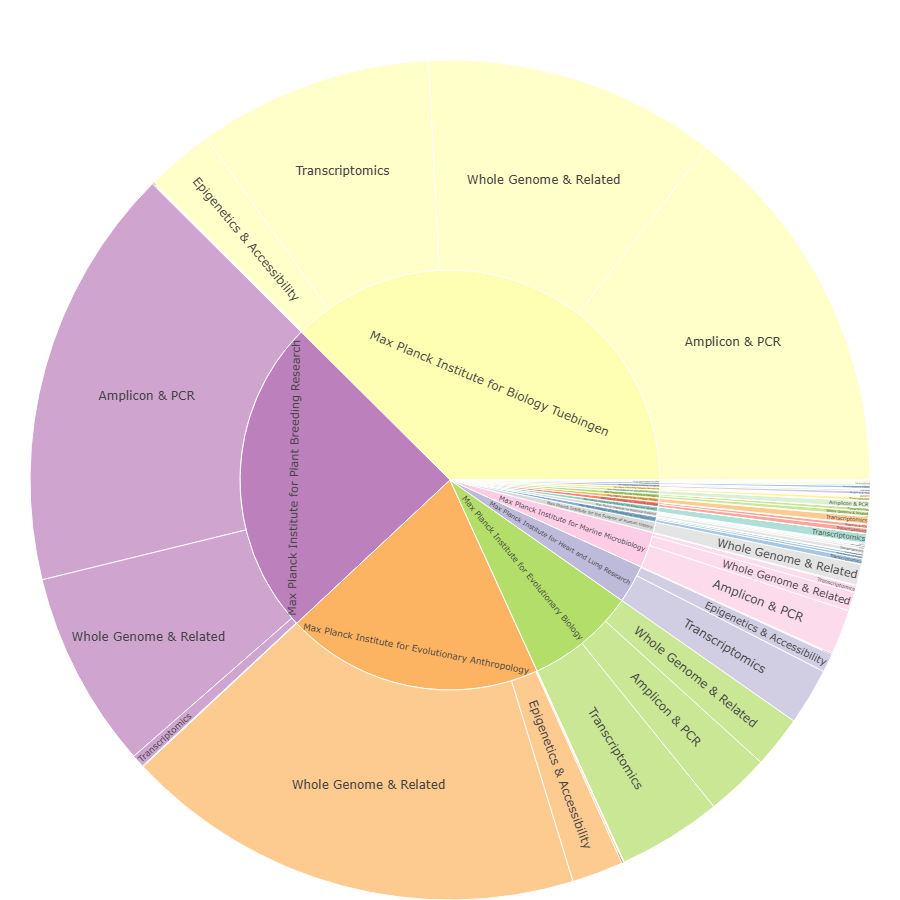
Library strategies by institute
Composition of library strategies per institute (e.g. whole genome & related, transcriptomics, amplicon/PCR, epigenetics & accessibility), highlighting how scientific focus and established pipelines shape sequencing demand.
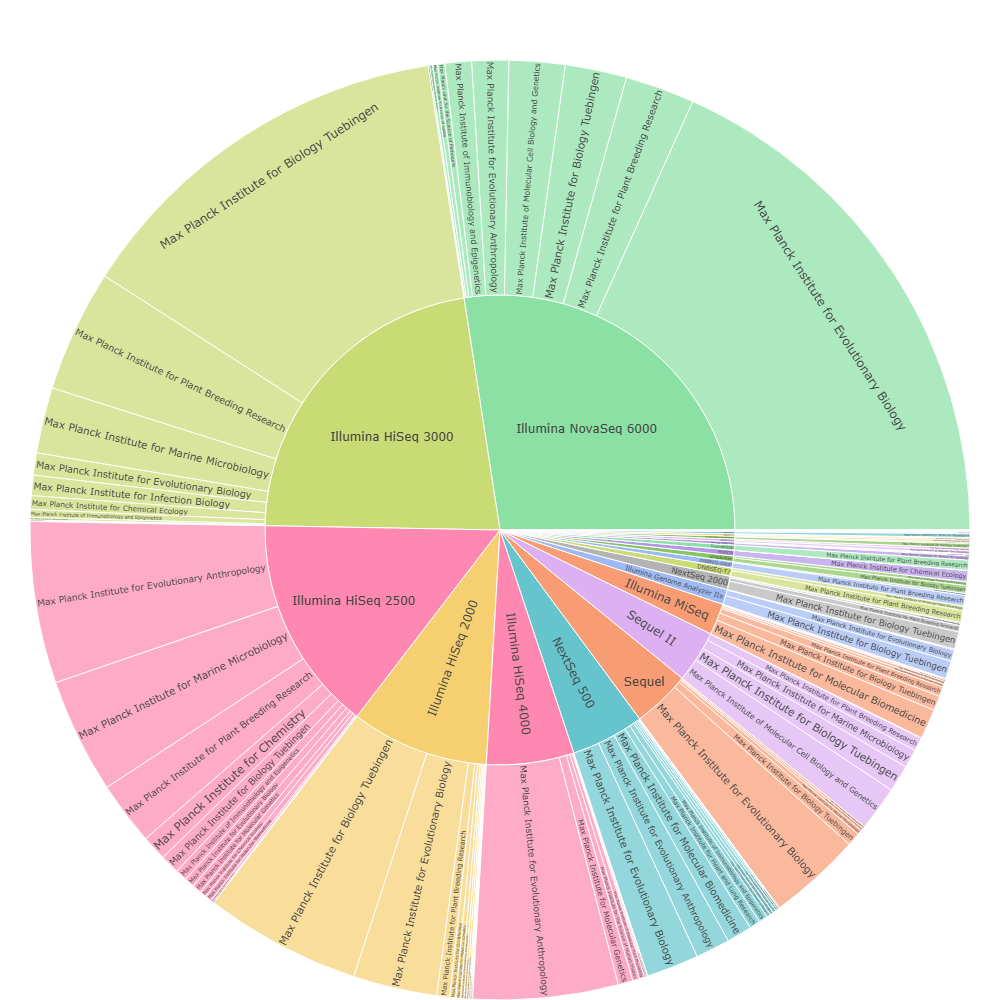
Platform usage per institute
Platform mix per institute at instrument-family level (e.g. NovaSeq, HiSeq, Sequel), showing heterogeneity in adoption and the persistence of legacy systems alongside newer high-throughput platforms.

Main institutes per platform
The inverse view: for each platform/instrument family, which institutes contribute most of the observed usage. This is useful for identifying “anchor centres” that drive volume and therefore influence procurement inertia and platform transition dynamics.
From a market intelligence perspective, this example illustrates that sequencing “markets” are rarely uniform: volume is often concentrated in a small number of high-throughput institutes, while adoption of newer platforms typically begins through localized pilot deployments before scaling organisation-wide.