Global Sequencing Market Observatory
This section uses large-scale public repository metadata (with a particular emphasis on ENA) to approximate global academic sequencing activity and expenditure trends over 2016–2025.
Scope & Caveats: the goal is trend analysis (rates of change, relative shifts, concentration), not perfect absolute spend. Cost estimates necessarily rely on approximations where key commercial parameters are not public (e.g. flow-cell utilisation, pricing packages, discounting, etc.).
- How has sequencing expenditure evolved over time, and how concentrated is spend by vendor/instrument?
- Which platforms and instrument families are gaining share?
- How do instrument models compare in economic positioning (cost-efficiency vs. throughput scale)?
Using ENA and related public sources, I compiled sequencing metadata estimated to cover ~95% of all experiments deposited in major repositories between 2016 and 2025, corresponding to approximately ~30 million experiments, ~30 million runs, and ~3 × 10¹⁴ reads.
For each accession level (sample, run, experiment, study), the dataset captures:
- Sequencing platform and instrument model
- Total read and base counts
- Library metadata (strategy, source, selection)
- Submitting center / institute name
Expenditure Trends and Market Concentration
Cost estimations are derived using platform and model-specific formulas, combining vendor reagent lists and (where possible) adjustments for run-throughput differences and historical pricing changes.
Unless otherwise specified, these are best interpreted as run-level reagent cost proxies rather than fully-loaded cost-of-ownership.
Top: Annual growth in sequencing expenditures, with recent peaks. Illumina remains the leading platform, while MGI / BGI, PacBio, and Oxford Nanopore show a steady rise, consistent with a gradual diversification of the platform mix.
Bottom: Cumulative expenditure by instrument model (2016–2024), highlighting strong concentration in a small number of short-read instrument families and reinforcing their market dominance.
- Concentration signal: a small number of instrument families dominate spend, suggesting high switching costs and inertia in exploring alternative platforms.
- Disruption signal: despite increasing cost competitiveness of several challenger platforms, adoption remains constrained by non-price factors such as installed base and workflow inertia.
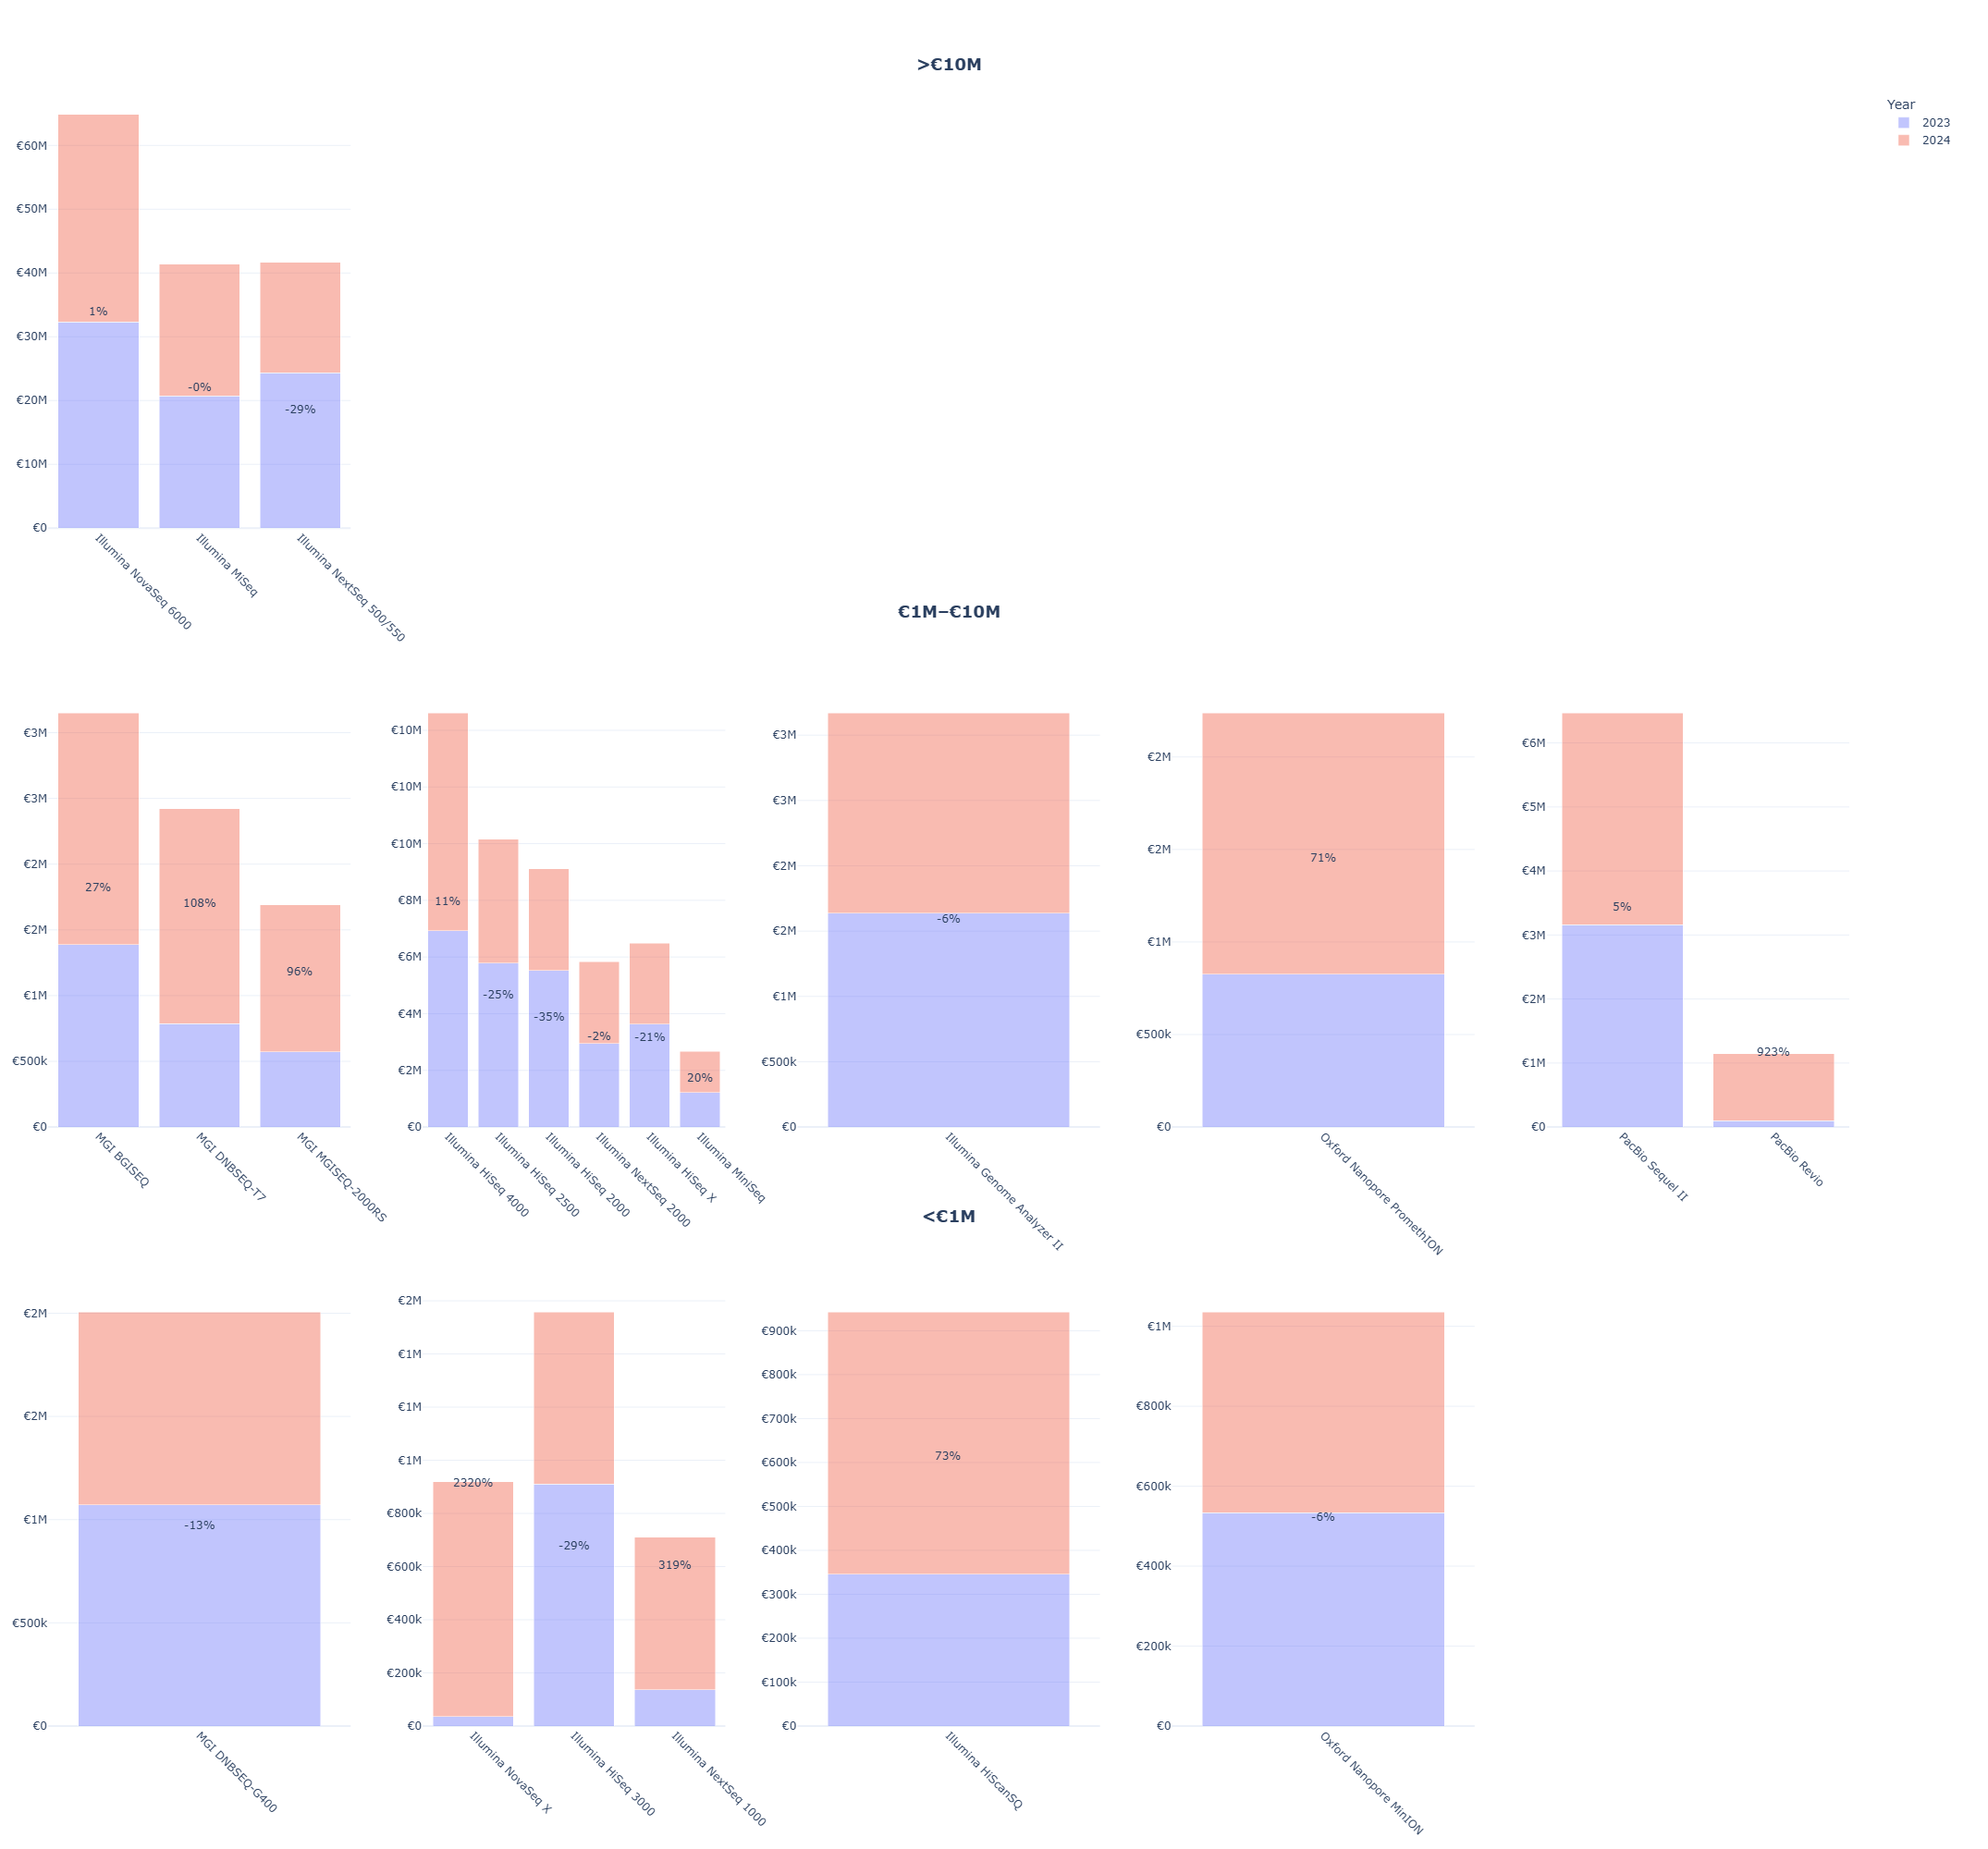
2023 – 2024 % expenditure changes per platform and model
Cost-efficiency, Scale, and Read-length Positioning
Economic positioning across sequencing instrument models
Tip: pan to adjust view
Bubble plot summarizing economic positioning across sequencing instrument models.
- Bottom-right: high-throughput short-read systems with strong cost-efficiency at scale.
- Upper regions: legacy or low-throughput systems with higher per-Gb costs.
- Distinct clusters: long-read platforms occupy separate cost–throughput regimes.
Relationship between average read length per experiment and experiment-level sequencing cost
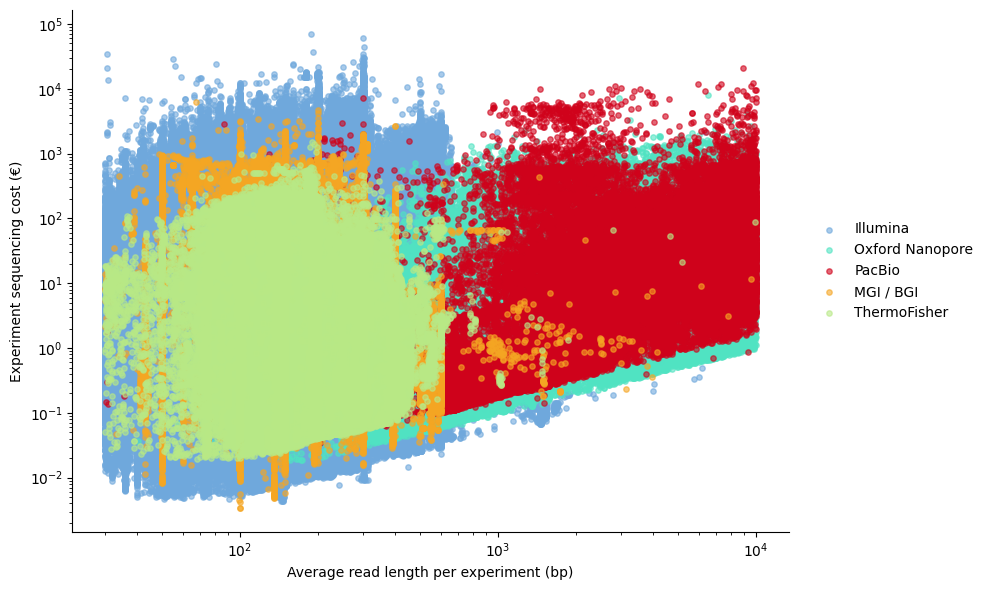
Short-read platforms dominate the low read-length region (~100–300 bp) and span a wide cost distribution, reflecting diverse use cases and budget constraints. Long-read platforms cluster at longer read lengths with higher cost variability, consistent with their use in specialised applications rather than broad sequencing.