Mapping Researchers, Methodologies, and Institutes in a Knowledge Graph
Here I showcase implementation of a knowledge graph that aggregates and structures scientific studies around sequencing technologies, methodologies, researchers, and institutes, enabling analysis that goes beyond traditional tabular or bibliometric approaches.
The graph integrates studies covering major sequencing modalities, including RNA-seq, scRNA-seq, WGS, WES, and ATAC-seq, and explicitly models how methods, platforms, institutions, and geographies intersect.
While implemented using graph-native technology, the conceptual model is portable to relational or hybrid SQL–graph architectures.
Core Database Structure

The schema is designed to capture who uses what, where, and how, supporting queries such as:
- Which institutes are driving adoption of emerging sequencing methods?
- How platform usage differs across countries or research domains
- How specific methodologies diffuse over time across the research landscape
Visualising Query Capabilities
The graph enables flexible traversal across entities, allowing rapid exploration of:
- studies linked to specific journals or methodologies
- researchers grouped by geography or institutional affiliation

📽️ Additional Media
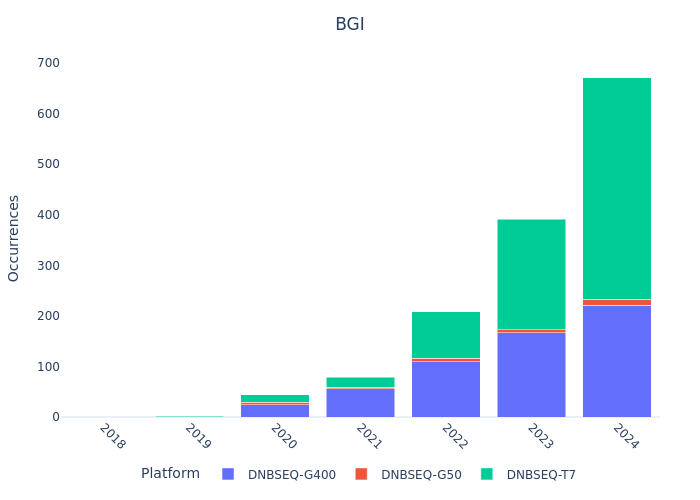
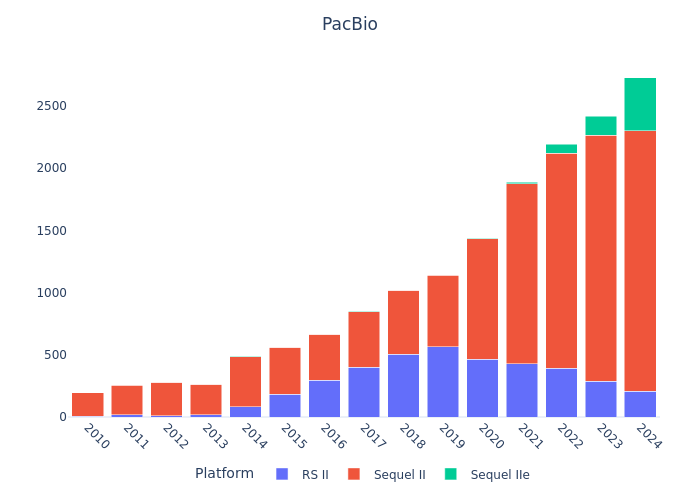
Querying Platforms, Techniques, and Methodologies
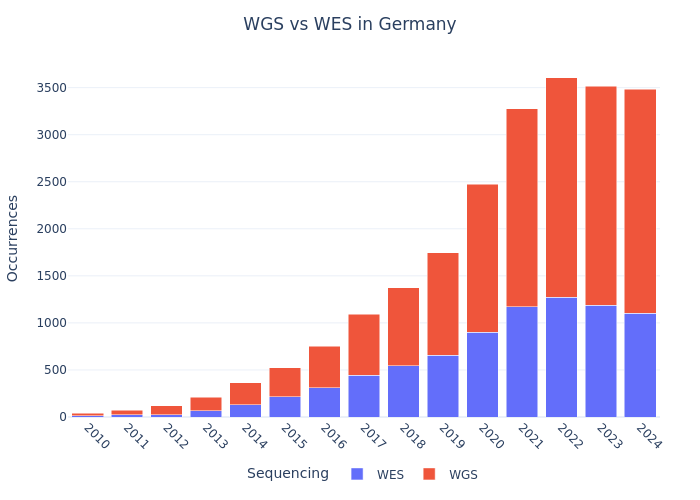
The plots below illustrate how the graph can be queried to surface technology prevalence and methodological patterns across the literature.
Sequencing Platform Mentions


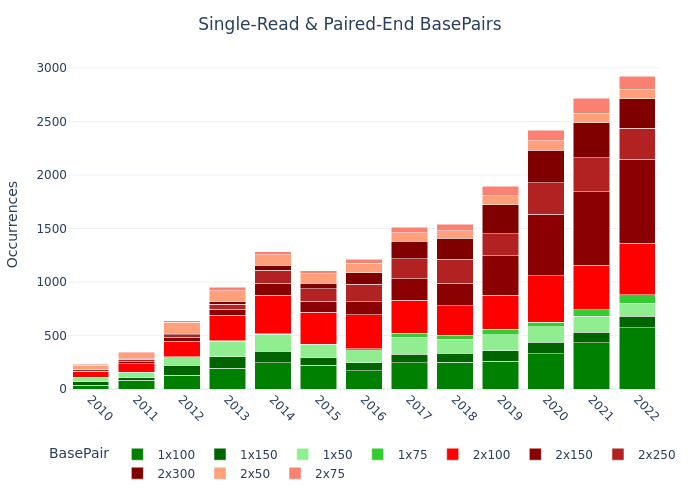
Single-read vs Paired-end & WGS vs WES (Example: Germany)
Single-cell and Spatial Transcriptomics

